Over the years, JavaScript charting libraries have emerged as the most powerful and effective tools for visualizing data in the form of beautiful and interactive charts. A JavaScript charting library provides editable code for you to include in your web portals online charts that can be animated, interactive, and/or connected to data sources. Furthermore, JavaScript charting libraries not only help you to easily create clear and readable charts but also allow you to add data visualization and tooltips for more information.
They can also be interactive, allowing users to click to dive deeper into the data that interests them. With that said, while JavaScript charting libraries offer many benefits, selecting the right one is not as easy as it sounds. Why? you may ask. Well, there are a plethora of JavaScript charting libraries on the market today, which makes it harder to choose the best one.
Are you having difficulty choosing the right JavaScript charting library? Not to worry! Let’s find out some of the important factors to consider when choosing a JavaScript charting library.
Tips to Choose the Right JavaScript Charting Library
You need to consider seven factors when choosing a JavaScript charting library.
1. Compatibility with your development stack
Let’s face it—choosing a JavaScript charting library without checking whether it is compatible with your development stack may not be the brightest idea. Depending on the framework you are using, you may want to ensure that the library plays well with it. Furthermore, some JS chart libraries like FusionCharts have ready-to-use plugins that allow easy usage in front-end technologies like React, Angular, jQuery, and Ember, among others, and in back-end technologies like ASP.net, Java, PHP, Django, and Ruby on Rails.
2. Cross-device compatibility
Will your web application be used primarily on desktops, or are you targeting smartphone users as well? If your application is built for desktops, most of the JS chart libraries will work for your dataviz component. However, if you want to ensure a consistent experience across desktop as well as mobile devices, the charting library you choose should be responsive. Furthermore, this is becoming increasingly important because of changing user habits in recent times.
3. Cross-browser compatibility

When it comes to choosing the right JavaScript library for your project, make sure you check whether it is compatible with all the major browsers. Furthermore, if you are building a web application for government or for enterprise clients, there is a very good chance that they are still using older versions of IE. So JavaScript charting libraries that work only with modern web browsers might not be an ideal choice.
Make sure the JavaScript charting library you choose is compatible with both modern and old browsers. FusionCharts, for example, is compatible with a wide variety of modern and old browsers, ranging from IE 8 to Google Chrome.
4. Advanced features
For visualization, most of us just need basic charting and graphing capabilities. However, if you think you will need a robust set of additional features such as legends, drill down, zoom/scroll/pan, or annotations, among others, you need to ensure that your charting library has the capability to handle those features.
5. Support and documentation
It goes without saying that good documentation and a vibrant online community could help you to get started fast and move ahead whenever you face hurdles during the development. Not to mention, documentation and demos will also help in getting the chart implemented faster, so make sure you keep an eye out for that.
However, there may be times when you would need a fast response to the issues that you are facing. In such cases, you may consider charts that provide technical support. Furthermore, your obvious choice would be a commercial chart in this case.
6. Range of chart types
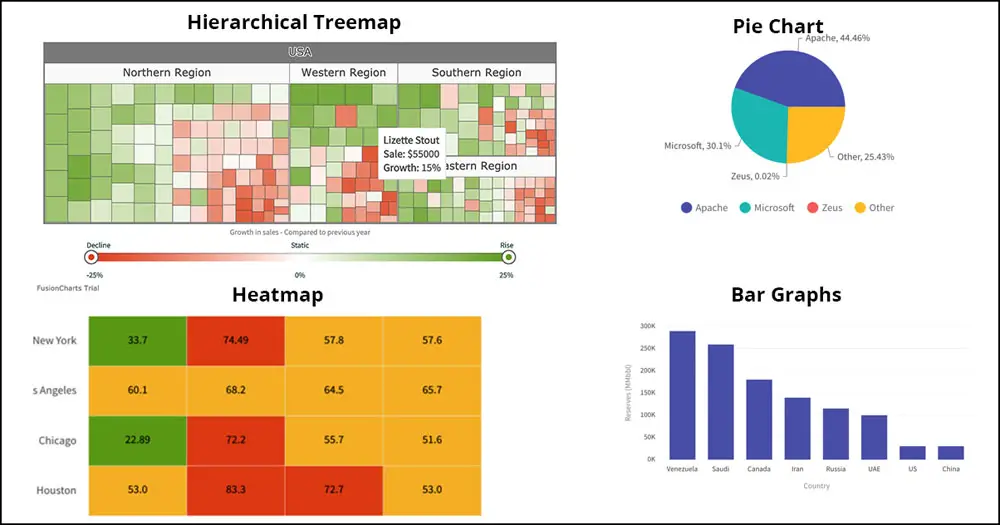
Before choosing a JavaScript chart library, make sure you determine the types of charts you need to visualize and analyze the data. Are basic chart types like pie charts, bar graphs, and so on enough? Or do you need more specialized, advanced chart types like heatmaps or hierarchical treemaps?
Even though it is vital that you choose a JavaScript charting library that satisfies all your requirements, it is crucially important that you do not get a bloated library. Don’t go for a library with all possible chart types that you don’t even need. It might slow your website to death in the short term. Furthermore, the right balance is very important.
7. Price
While price may be high on your priority list for choosing a JavaScript library, make sure your decision is not entirely based on that alone. However, it is vital that you compare the pricing plans for different JavaScript charting libraries before making the final decision.
Furthermore, while comparing the pricing, you should consider the total cost of ownership and not just the upfront cost of the license. Make sure you don’t choose a library with the lowest upfront cost as additional expenses such as maintenance, upgrades, and support can add to the total cost in the long term.
Some of the JavaScript charting libraries give away their source code when you purchase the license, but that does not mean you also get the right to use it in whatever way you want. License terms and pricing vary based on the number of users, type of application, and so forth. Some companies may offer multiple versions of the JS chart library based on the chart types, features, and API access, so make sure you check that before choosing a JavaScript charting library.
Still confused about which JavaScript charting library is the best? Let’s look into some of the best ones on the market.
Top JavaScript Charting Libraries
FusionCharts

Widely regarded as one of the best, FusionCharts is an industry-leading JavaScript charting library that offers a unified experience across all browsers as well as devices. With 100-plus chart types and 2,000-plus maps, it offers integrations with all popular JavaScript frameworks as well as server-side programming languages.
Overall, this JavaScript charting library has just about every feature you could need to make beautiful charts and graphs for some serious business analysis. Here are some of the main features of FusionCharts.
-
Ease of use: This JavaScript charting library is easy to use. Furthermore, there is no need to learn Flash or any other authoring tool to use FusionCharts.
-
Documentation and support: In addition to API references and code examples, FusionCharts comes with comprehensive documentation for all types of charts.
-
Build interactive charts: With the help of FusionCharts, you can create interactive charts and maps. Features like panning, scaling, and zooming are not supported by other JavaScript charting libraries like Google Charts but are available in FusionCharts.
-
Customizable: One of the many things you will love about FusionCharts is that almost everything is customizable. From captions to point color, users can customize everything to their requirements.
ZingChart
-1.jpg)
Known to be fast, user friendly, and interactive, ZingChart is a JavaScript charting library that lets users create interactive charts and graphs for web applications. Used by tech giants like Microsoft, Adobe, and Apple, among others, this JavaScript library is built with HTML5, Ajax, and JSON and as such can deliver beautiful graphs and charts in no time.
Furthermore, ZingChart offers more than 35 responsive chart types and modules. They can be themed and styled by CSS and can render big data fast. Here are some of the major features of ZingChart.
-
Self-contained: This JavaScript charting library is totally self-contained. Furthermore, this means the entire state, data, and configuration of any graph or chart can be saved as a JSON packet.
-
Fast and flexible: This JS chart library is fast and flexible and allows for managing big data and easily generating graphs and charts with large amounts of data.
-
Dependency-free: ZingChart has zero nonnative browser dependencies. This allows for strong backward compatibility and easy integration across any web platform.
Highcharts
-1.png)
Highcharts is a cutting-edge, multiplatform JavaScript charting library that makes it easy for developers to add interactive charts to web and mobile projects of any size. Just like other JS chart libraries, Highcharts comes with a number of prebuilt graphs like spline, area, column, bar, and pie, among others.
Even though Highcharts is free for personal use, you need to buy a license for commercial usage. Here are some of the main features of Highcharts.
-
Compatibility: The JavaScript charting library is compatible with all modern devices and browsers, including iPhone/iPad and Internet Explorer from version 6.
-
Simple configuration syntax: No special programming skills are needed for its configuration.
-
Export and print: After enabling the exporting module, users can export the chart to PDF, PNG, SVG, or JPG format or print directly from the web page.
D3.js
-1.jpg)
D3.js, short for Data-Driven Documents, is a JavaScript charting library for creating beautiful, dynamic, interactive data visualizations in web browsers. Due to the fact that D3.js is open source, you can work with the source code and add your own features. It supports numerous chart types, many more than the vast majority of the other JavaScript charting libraries.
Not to mention, many advanced data-manipulation and visualization functions are built in and implemented, which means a new D3.js user can easily create effects that would otherwise require years of experience. Here are some of the main features of D3.js.
-
Extremely fast: Since D3.js is lightweight and works directly with web standards, it’s extremely fast and works well with large data sets.
-
Huge community: D3.js has a huge community backing it, so it is easy to find people to help with whatever you are doing.
-
Supports numerous chart types: Last but certainly not least, D3.js supports a far larger number of chart types than the vast majority of existing JavaScript charting frameworks.
Conclusion
With JS chart libraries, there’s no one-size-fits-all solution. Furthermore, the space is very competitive, and JavaScript charting libraries are always improving.
Whether you want to create real-time charts or need to show your users a historical trend, make sure you keep in mind the above-mentioned tips and tricks for making an informed decision.
Final Takeaway
The best library for your project will depend on your particular needs. If you’re looking to do basic data visualization with a simple bar or pie chart, ChartJS is a solid solution. For something more powerful and flexible, you might also consider FusionCharts, which offers premium charting services in exchange for its charting library. And if you need to build charts that are accessible to the visually impaired, DC.js may be a good fit. But rest assured: with so many JavaScript charting libraries available today, there’s almost certainly one that will meet all of your needs when it comes to visualizing data on platforms like blogs and websites.